

– A guided tour around Zoom Earth
Eric Clifton was born on 2 March 1932. He was a Navigator who flew in aircraft during the 1950’s and 1960’s using old school navigation equipment such as mechanical altimeters, compasses, sextants, callipers and maps. On clear sky nights he could navigate using charts and the stars.
At that time there was no ‘Fly by Wire’ except for the metal cable from the Pilot’s peddle to the flappy thing at the back of the aircraft. They did have ‘Wireless’ but this was a radio communication machine which relied on radio waves and a radio operator receiving the signals on the ground.
Eric passed away on 26 March 2022 just after his 90th birthday.
This was so sad for two reasons.
The first reason is that he was a larger than life character of a man. He loved chatting and would happily talk about a huge range of subjects, especially the weather, stars, rivers and cricket. He worked hard throughout his life and was always positive. He was interested in everything and always keen to learn and understand new concepts. He was loved by so many humans and leaves a huge gap in our lives.
The second reason why his passing is so sad is that he never got to see and navigate the Zoom Earth website or experience the amazing delight of exploring it. There is absolutely no doubt that he would have loved this software and been blown away by the visually dynamic screens and sheer amount of information available at the click of a mouse.
If you have an interest in weather, its patterns, tempestuous storms, freezing polar temperatures and all things from the Earth’s surface up, buckle up and enjoy this tour around Zoom Earth.
1. ABOUT THE ZOOM EARTH WEBSITE
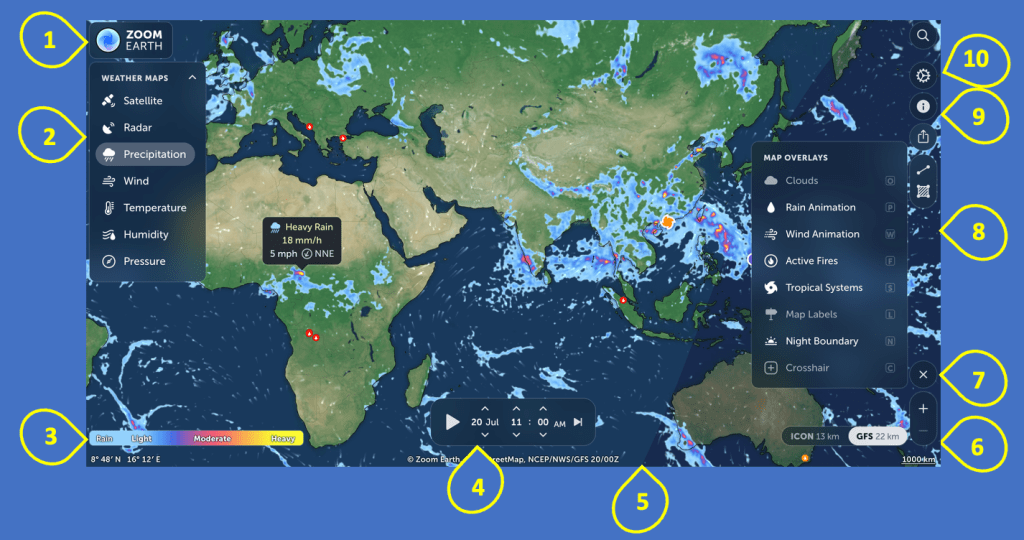
Our tour starts with the Zoom Earth logo and progresses anticlockwise.
The application is:-
- Free to use
- No Account required
- No download required
Where are You on Planet Earth?
So, when you first use the website it will ask for your location. I would suggest that you enter your nearest city only. This is helpful because the software will always open with a screen in the vicinity of your location. I live in Hampshire, UK. For a long time the software believed I lived in Recife, Brazil?
2. WEATHER MAPS
The weather Maps dropdown menu offers seven options :
- Satellite
- Radar
- Precipitation
- Wind
- Temperature
- Humidity
- Pressure
So let’s start at the third option Precipitation because British people always wish to know if it is going to rain!
3. KEY
If we look at the bottom left quadrant we can see the KEY in relation to precipitation. It is important to be aware that this KEY changes for the above options, each of which has a visually distinctive screen as you will see.
4. PLAY ANIMATION
In the lower central part of the screen you will see a grey/black bar which shows the ‘Now time’. You will be familiar with the white ‘play’ triangular button on the left side of this bar. If you click this triangle it will start an animated forecast for the next couple of days. There are up and down arrows above and below the day month / hour / minute. You can click these arrows to move the screen to an earlier time/day and see previous displays.
On the right side of the grey/black bar is a reset button. Clicking this will reset the screen to the current day/time.
5. DAY/NIGHT
There is a subtle difference between the daytime and nighttime boundary as the earth rotates.
6. ZOOM IN/OUT
The – and + buttons allow you to zoom in or out. You can also do this with a mouse and assistive technology options
7. MAP OVERLAYS
Click the Map Overlay option and you will see 8 further options to personalise your Zoom Earth experience.
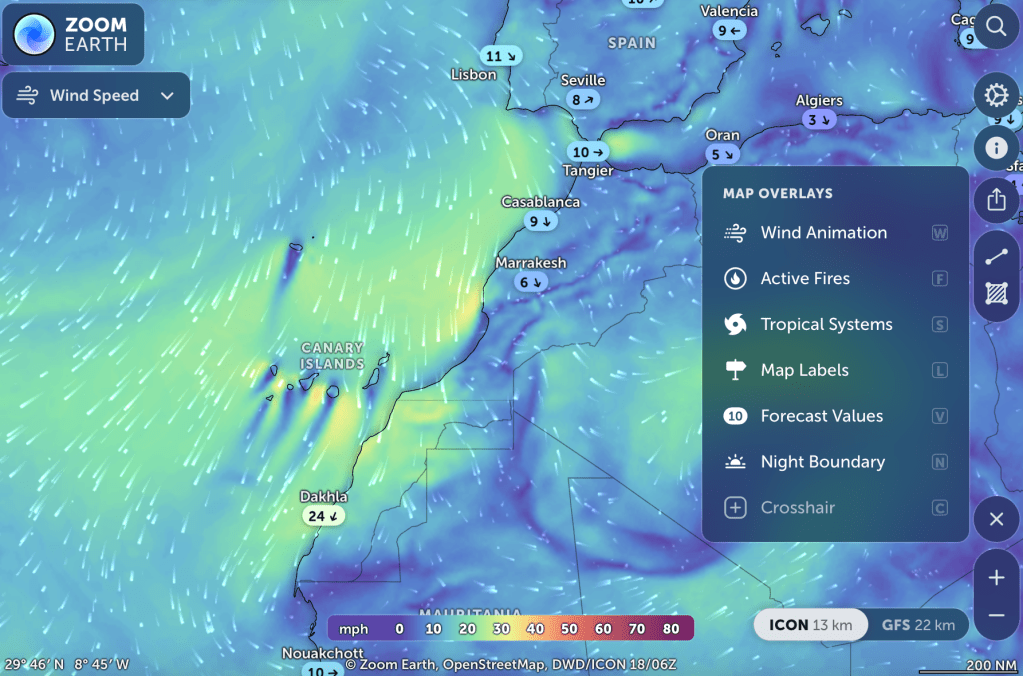
8. WIND
The wind screen (not the vehicle version!) comes to life when it is animated.

The Wind Animation is the third option in the More Map Overlays drop down box. Click the Wind Animation Icon. It is a simple on/off button.
As you can see, the whole display is much more active now. Once activated, the wind animation will appear on all of the weather screens with the exception of the HD Satellite.
If the screen is operated with a mouse, when the mouse pointer is moved across the screen, a pop up will appear with, in this case, the wind speed and direction.
Wind – Points of interest. The Canary Islands and other island groups have a Windward and a Leeward side. The Leeward side is clearly illustrated by the blue colouring which indicates little or no wind.
Rotating Storms
Rotating wind patterns do not necessarily indicate a hurricane or cyclone or typhoon. Oftentimes it is possible to see a clearly established and large area of wind moving at speed around a central point. However, the conditions for a hurricane, typhoon or cyclone to develop are more complex and the path these weather events take can be very unpredictable.
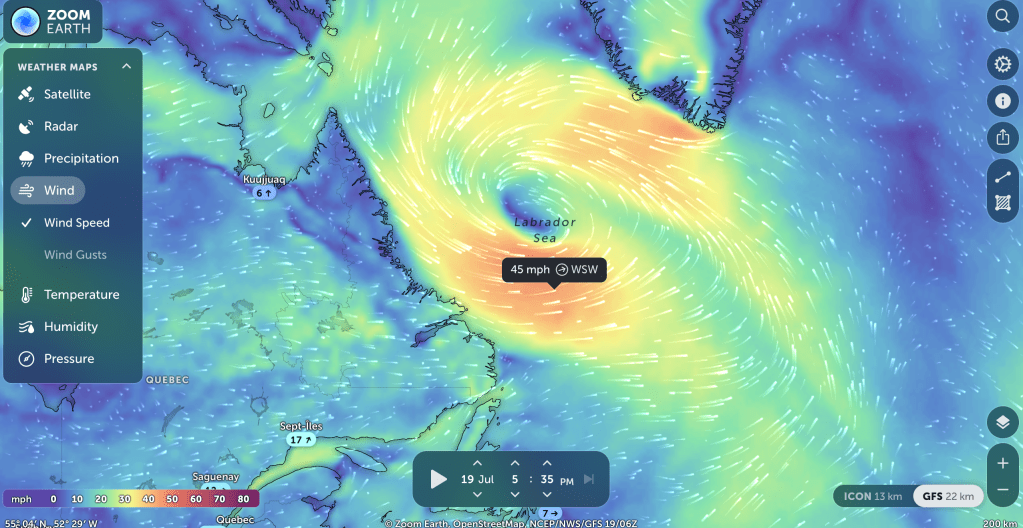
Depending on where in the world they form, rotating storms have different names. Tropical cyclones that form in the Caribbean or North American regions are known as Hurricanes. Those that form in the Far East, close to places like China and Japan are known as Typhoons and those that form in the Indian Ocean are called Cyclones. If a tropical cyclone forms above, or north of the equator, it spins in an anti-clockwise direction. If it forms below, or south of the equator, it spins in a clockwise direction. This is all because of the way the Earth turns on its axis.
Find out more in this BBC Bitesize article.
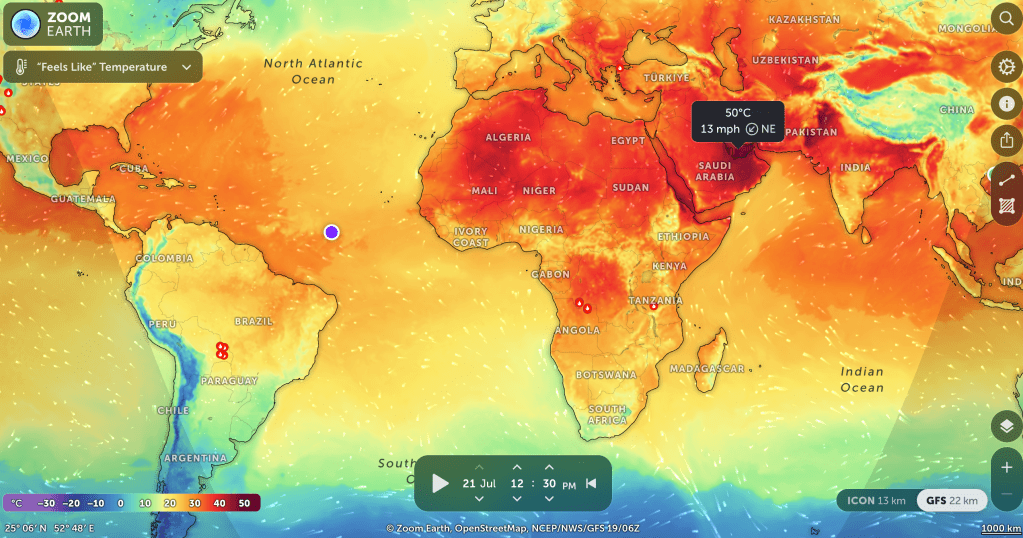
WEATHER MAPS – TEMPERATURE
The Temperature Key shows a range from – 30 to + 50. In reality the extremes are far greater and this can easily be seen in the Antarctic where temperatures of <-89 can be seen.
Wikipedia has more information about the Lowest Temperature Recorded on Earth.
Day and Night Temperatures
From the More Overlays drop down options, select ‘Night Boundary’. Run a forecast. You will see how the temperature varies between day and night with the subtle grey day/night wave indicating the changing time zones moving across the planet. You may notice the extent of the day/night wave peaks during summer/winter at the polar regions when, in June/December, it stays light/dark all day long.
When you run a temperature forecast, you can watch how the very hot areas cool overnight. If you are using a mouse, you can place the cursor over a specific place and see the temperatures rise and fall for that place over the hours as the sun passes and also see the speed and direction of the wind.
Hot Spots
One of the satellites used to provide data for these screens can detect Hot Spots. These are areas where the ground temperature is noticeably higher than the surrounding areas. These are displayed in three ways:
- Red. These are ‘wild’ fires
- Orange. These are permitted fires described as ‘Prescribed Burn’
- Fuzzy red/orange. These are small areas of heat which may or may not be a fire. An example of this is an Icelandic fissure volcano
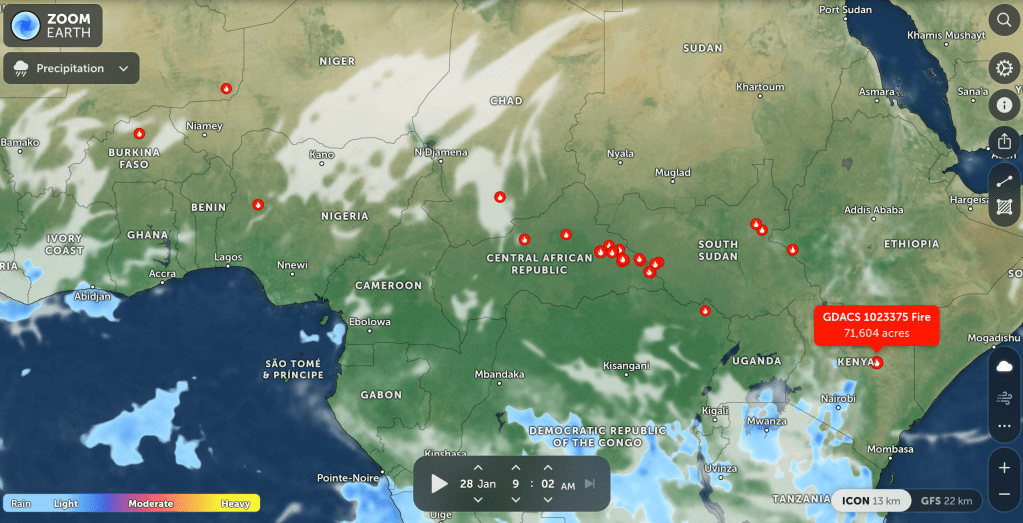
The image above shows the beginning of the ‘Fire Season’ across the tropical green belt of Africa.
WEATHER MAPS – HUMIDITY
This is a relatively straightforward display which gives percentage humidity readings at key locations. The more you zoom into the map, the more locations appear.

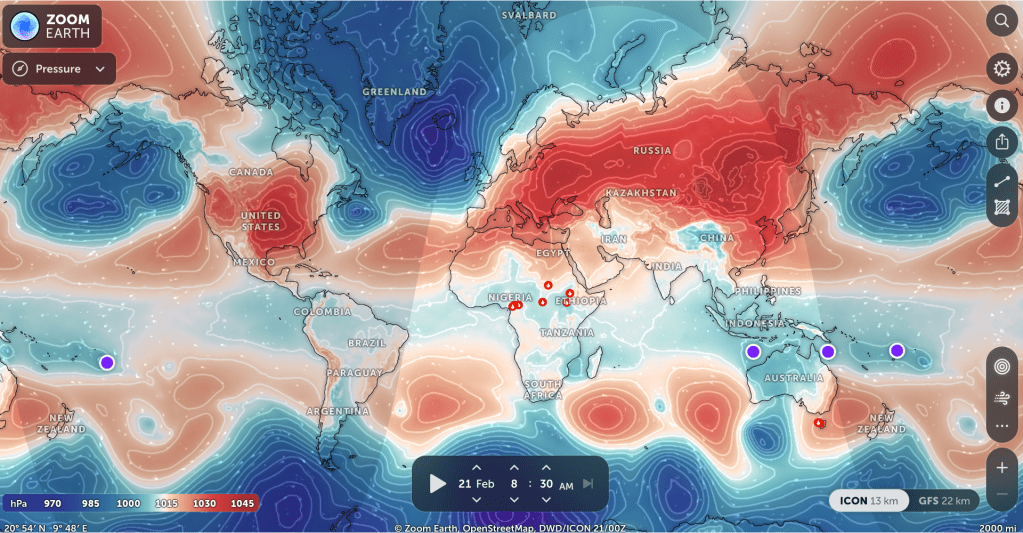
WEATHER MAPS – PRESSURE
Red = High Pressure Blue = Low Pressure
The key shows a range between 970 and 1045. It is useful to combine the wind animation overlay.
WEATHER MAPS – SATELLITE
The satellite view comes in ‘Live’ and ‘HD’ options.
The satellite image below was captured during the California fires in January 2025.

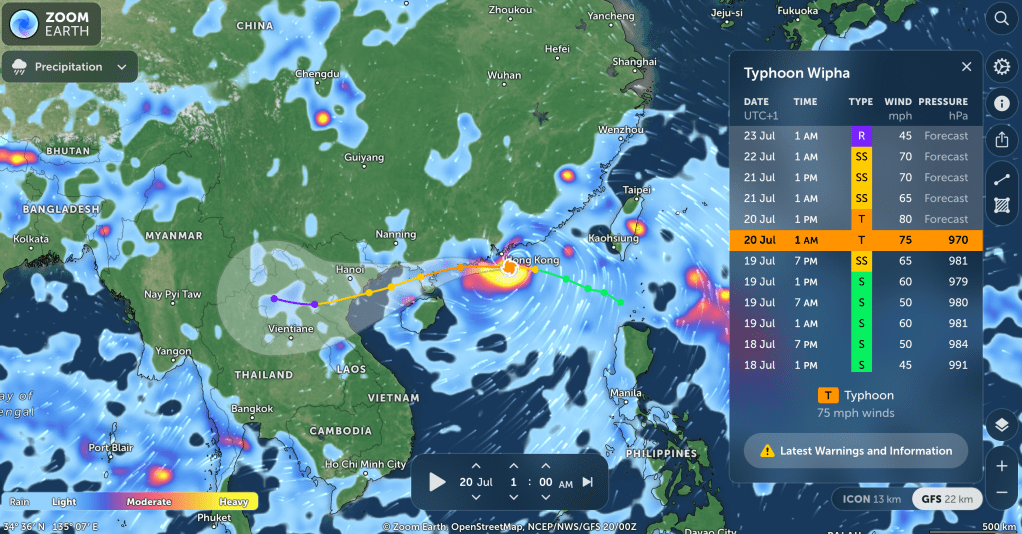
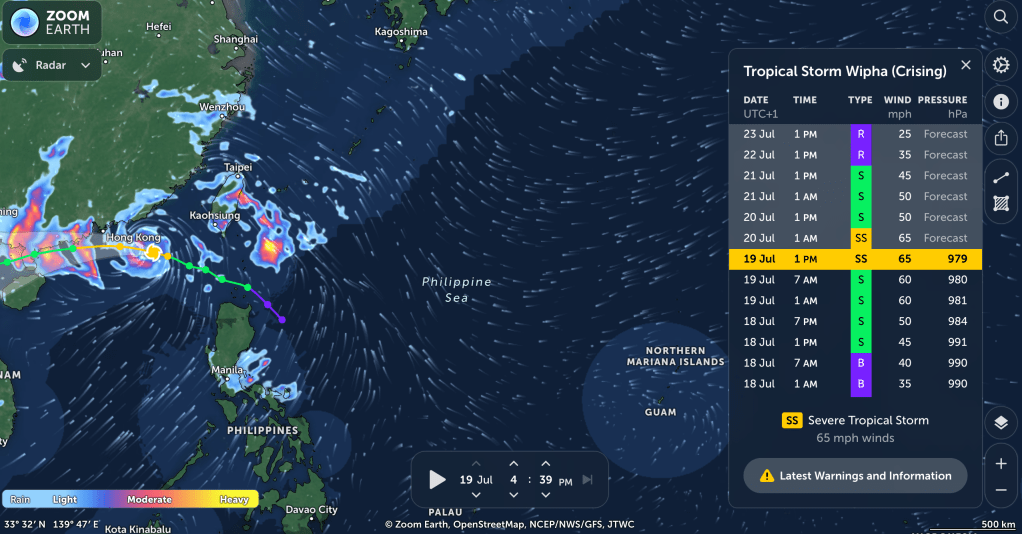
WEATHER MAPS – RADAR
This display shows circular areas of the planet which are covered by radar. Within the radar area, rain events are displayed. This is a live display and therefore there is no forecast as such.
However, the ‘radar’ image below, taken on 19 July 2025, does show the Tropical Storm Wipha (Crising) approaching Hong Kong. The word Crising is a term used in this area. It is similar to the English word crisis and indicates a dangerous storm. Often a named storm is later referred to as “Crising”
9 ABOUT ZOOM EARTH
Zoom Earth is a software application designed by British software designer Paul Neave.
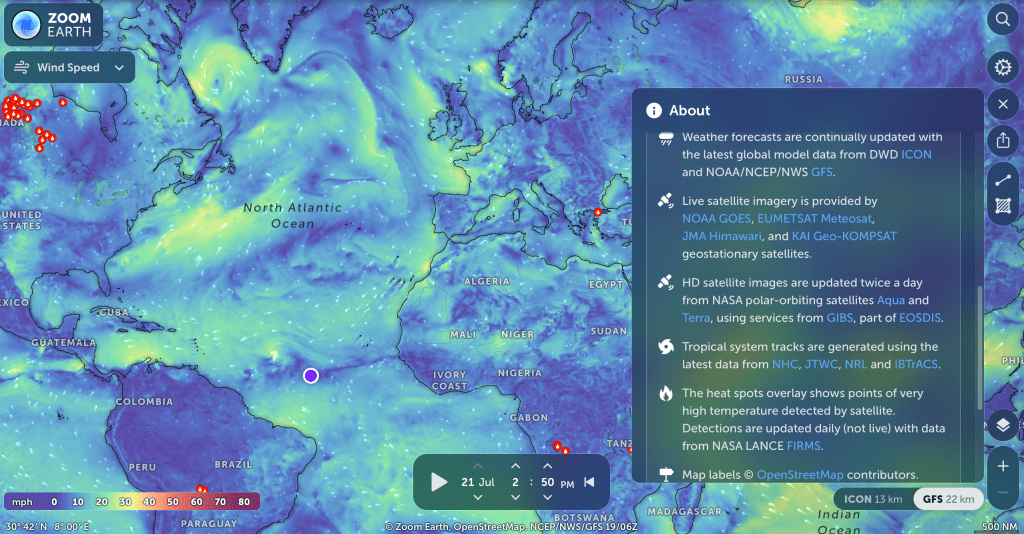
If you select the Information button ‘About’ you will see information provided by Neave Interactive. Scroll down and you will see a list of Data Sources. The information is pulled together to provide often real time information.
‘Open Source’ data is available to any person or business and is free to use. Neave Interactive have taken this data and, using Flash Drive, has created a multi screen tapestry of information in a user friendly format.
10 SETTINGS
The final stop on our tour of Zoom Earth is the ‘Settings’ icon. The dropdown screen will give you options to personalise your experience of watching the weather, including choosing the language. It is worth exploring these options.
TOUR OF ZOOM EARTH – CONCLUSION
It is difficult not to be a massive fan of this website and to be witness to the biggest view of Planet Earth and the daily weather patterns.
As with all software, we have to be mindful of the ‘feet on earth‘ realities and cross referencing the imagery of Zoom Earth and other weather forecasting websites with other online factual resources. In the UK the BBC verified news articles can be a trustworthy reference point.
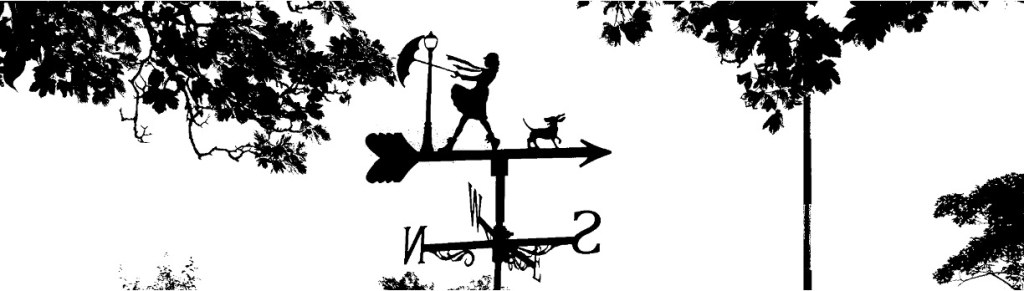
When all else fails in the UK, check the barometer, look up to your local weather vane or keep a piece of seaweed nailed to your doorway. Alternatively, if you step outside and it is wet, take your brolly. At best it is raining now and you need an umbrella, with luck it will be sunny later and you can roll it up and use it as a walking stick!
© Bo Nightingale 2025
